One condo, six in 10 sales: Thomson Reserve dominates October
The 1,029 sales at Thomson Reserve drove October’s rebound. Its share of activity and price mix offer a more useful starting point for launch buyers than the monthly total alone.
Published 2026-11-18 · 5 min read
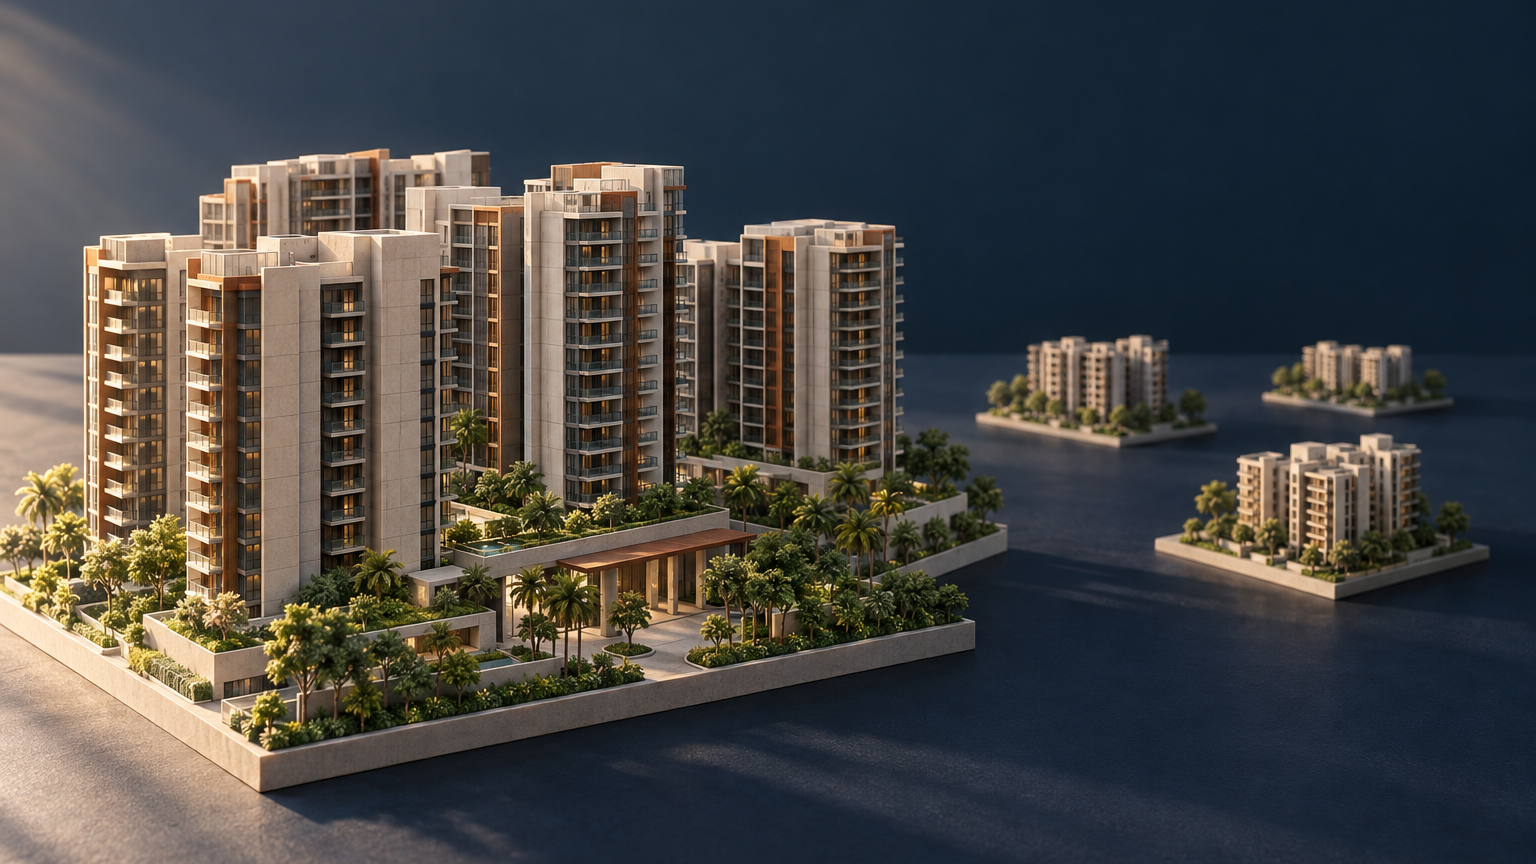
Thomson Reserve sold 1,029 homes in October 2026, accounting for about six in 10 of Singapore’s 1,716 new private-home sales that month. The reported islandwide total, which excludes executive condominiums, was the highest monthly tally since October a year earlier.
For buyers comparing new launches, the striking detail is how much of that activity came from a single condominium project. Thomson Reserve sold roughly 81% of its 1,268 units during the month, calculated from the reported figures. That makes its own sales performance worth examining before treating October’s islandwide jump as a reason to buy elsewhere.
How much of October came from one project?
Dividing Thomson Reserve’s 1,029 sales by the islandwide 1,716 gives 60.0%, rounded to one decimal place. Subtracting those sales leaves 687 homes sold across all other projects. These are calculations from the reported October figures, not an estimate of what sales would have been had Thomson Reserve not launched.
The concentration also helps explain the regional result. The Rest of Central Region, the market segment containing Thomson Reserve, recorded 1,157 sales, or about 67% of the total. Thomson Reserve therefore supplied approximately 89% of that segment’s sales, calculated from the reported counts.
For a buyer, those two denominators answer different questions. The 81% figure describes how much of Thomson Reserve’s total inventory sold in October; the 60% figure describes its share of the whole month’s market. Both show a substantial response to this particular project, but neither tells you whether the specific unit you are considering offers the best fit or price.
The useful next step is to move down a level: from the monthly market total to the project, then from the project to the actual unit. Popularity is relevant background. Your comparison still needs the home’s price, space and alternatives.
A sharp rebound, with a much larger launch calendar
October’s 1,716 sales compared with just 296 in September, an increase of about 480%. Yet October’s total was also 29.2% below the 2,424 homes sold in October 2025. The same month can therefore be a dramatic rebound from September and a quieter result than a year earlier.
The supply offered to buyers changed sharply too. Developers launched 2,058 units in October, compared with 158 in September. That gives the sales jump important context: buyers had a much larger batch of newly launched homes to consider.
It would be misleading to divide October’s sales by October’s launches and call the result a launch take-up rate. The monthly sales total covers developer sales across projects, rather than only homes first released that month. For Thomson Reserve, the reported 1,029 sales and 1,268-unit project size provide the more clearly bounded comparison.
For someone deciding whether to visit a launch, October’s activity is a reason to look closely at what attracted buyers—not a substitute for comparing the available choices. A busy month and a suitable home are different things.
What the S$2.5 million split tells you
PropNex chief executive Kelvin Fong said about half of the units sold at Thomson Reserve cost S$2.5 million or less, compared with about eight in 10 at Lucerne Grand. Those proportions refer to homes sold, not the full inventory or the units still available.
That is a useful distinction for buyers working within a total purchase budget. At the reported threshold, Lucerne Grand’s completed sales were more heavily concentrated in the lower price band. But this is a comparison of price distributions, not a like-for-like valuation of the two developments.
The practical question is which homes sat within that band. A buyer should compare the actual unit size, bedroom configuration and asking price of available alternatives, rather than assume that two homes below the same budget ceiling offer equivalent accommodation. The reported proportions alone do not supply that unit-level comparison.
Nor should “about half” become an exact count of qualifying homes. Keep the source’s approximation intact, and use it to frame a more specific enquiry about current choices—not as a promise of availability.
Why a higher median need not mean your chosen home rose in price
Fong also said median prices of new non-landed homes rose across all three market segments in October, largely because of the mix of homes sold at new launches rather than a broad-based increase in prices. That is his attributed explanation of the month’s movement.
A median is the middle observation in a set of sales. Change which homes sell, and that middle observation can move even without an equivalent price change for a comparable unit. For a launch buyer, the more useful evidence would be prices for genuinely comparable homes, with differences in size and unit characteristics made explicit.
October’s clearest result remains project-specific: Thomson Reserve attracted 1,029 sales and supplied roughly 60% of the month’s total. Whether its appeal extends to the home on your shortlist is the next question—and one that needs that unit’s price and alternatives, not another reading of the islandwide headline.